Office space use plays a key role in optimizing how you use your building. How does it differ from occupancy, though, and how can you actually improve it? Many facility managers track one metric without the other. That gap can lead to costly decisions about how much space a company needs.
Effective building use saves money, supports a good work atmosphere, and boosts productivity. People often mention space usage and occupancy in the same breath when discussing effective use. These terms describe different things, though.
This blog explains what office space use means and how it differs from occupancy. It also shows why understanding both numbers together matters for your organization. Good space planning depends on this distinction, since the wrong metric can inform decisions that cost you money down the line. By the end, you should have a clear framework for reading your own building data and making smarter space decisions.
Office space utilization vs occupancy: What’s the difference?
Some people treat occupancy and office space utilization as the same thing. In reality, these terms measure different things. Confusing them can lead to the wrong conclusions about how well your building actually performs.
Occupancy tracks how often people use a space compared to the total amount of time they could have used it. Consider a building with 100 meeting rooms, where people occupy only 20 of them on a given day. This produces an occupancy rate of 20%.
Office space utilization works differently. It measures how many people actually use an occupied space compared to the total number of seats available. As an illustration, a room containing 10 seats might have only 5 in active use. This room demonstrates a usage rate of 50%.
Both numbers matter, but they answer different questions. Occupancy tells you whether a space sees any use at all. Office space utilization tells you how efficiently people fill it once it is in use.
A building can score well on one metric and poorly on the other. That gap is exactly why looking at only one number can mislead you.
Why occupancy data alone gives you a false picture
Imagine a manager who takes frequent calls throughout the day. She occupies a large conference room designed to seat 200 people. She finds the quiet environment appealing and remains there for the entire day.
By the end of the day, this conference room shows a 100% occupancy rate. A facility manager glancing at this number alone would feel pleased with how the room performs.
Office space utilization tells a different story entirely. The manager occupies just one chair out of 200 available seats. This results in a utilization rate of only 0.5% for the room. This data gives the facility manager good reason to feel concerned about how people actually use this space.
This example shows exactly why relying on occupancy data alone creates a false sense of efficiency. Picture two rooms on an occupancy dashboard: one holds a single person camping out all day, the other holds a fully booked meeting. Both look identical on that dashboard. Only office space utilization data reveals the mismatch between the room's purpose and how someone is actually using it.
Multiply this scenario across a large office, and the financial impact becomes clear. Companies pay for square footage, furniture, heating, and cooling based on total room capacity. The actual number of people occupying those rooms on a given day has no bearing on this cost.
Picture this same pattern repeating across dozens of rooms. Even a small handful of employees doing this can quietly waste a large share of a real estate budget. Facilities managers who catch this pattern early can act on it. Doing so helps reduce wasted square footage and unlock meaningful cost savings over the long term.
Meeting room utilization: why bigger rooms underperform
Improving how efficiently you use a building requires looking at both occupancy and office space utilization together. Beyond these numbers, though, it helps to look at what people actually do inside these spaces.
Video calls, for example, happen frequently in meeting rooms. One person often occupies an entire room built for many, which produces low usage alongside high occupancy. Converting large meeting spaces into smaller pods can improve office space utilization significantly. Splitting them into several smaller rooms works just as well.
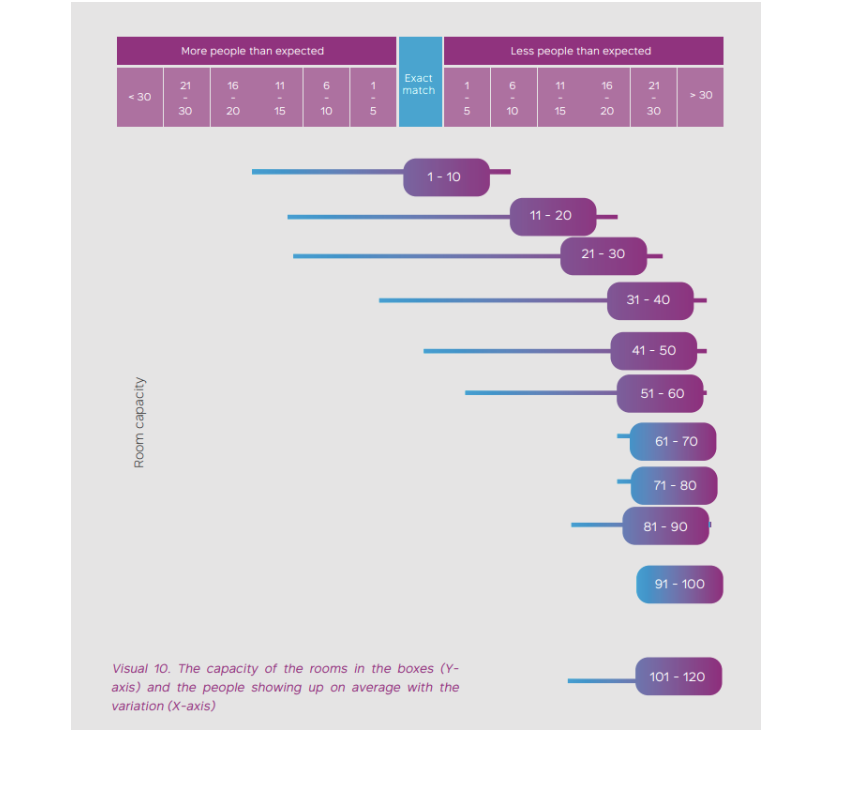
We grouped meeting space data across several projects. We then compared each room's capacity against the number of people actually using it. This comparison reveals the usage rate for each space size.
Smaller rooms, built for 1 to 10 people, tend to hit 100% office space utilization, matching capacity almost exactly. Large meeting rooms tell a different story. Their actual headcount often falls at least 30 people short of capacity, a significant gap between design and reality. Every organization differs somewhat, so your own results may look different depending on how your teams actually work.
This pattern repeats consistently across different industries and building types. Large rooms almost always underperform relative to their capacity, while small rooms tend to match their intended purpose closely. The lesson here is straightforward: bigger is not always better for meeting room design. A handful of small, well-placed spaces often serves a team better than one oversized room that rarely fills up.
How activity-based working raises utilization
Activity-based working models take this insight even further. These models take a different approach.
They do not give every employee one fixed desk. They do not give every team one fixed meeting room either. Instead, they offer a mix of space types built around specific tasks.
Quiet pods support solo focus work. Phone booths accommodate calls and video meetings. Small huddle rooms support two or three-person conversations. Larger rooms remain available too, reserved for occasions like all-hands meetings or client presentations.
Many modern working environments pair this approach with hot desking. Employees choose a desk each day instead of keeping one assigned permanently.
Fixed meeting rooms used to dominate office layouts. Today, collaboration zones and shared collaboration space often take their place. This shift gives teams more flexibility to gather when and where they actually need to.
Why utilization rates are often higher than occupancy rates
Usage percentages often come out higher than occupancy percentages, which can seem confusing at first. The math behind this makes sense once you understand what each number actually measures.
These calculations only include spaces that are actively in use. This calculation excludes empty meeting rooms entirely, which naturally pushes this percentage higher than occupancy.
Consider the following example. This calculation covers 10 meeting spaces, of which people occupy 5. This produces an occupancy rate of 50%.
Now consider only those five occupied rooms when calculating this rate. Each room contains 10 chairs, of which people occupy an average of 6. This produces a usage rate of 60%, clearly higher than the 50% occupancy rate calculated first.
This gap between the two numbers often surprises people at first. It becomes intuitive once you separate the two questions each metric answers. Occupancy asks "does anyone use this room at all?"
Office space utilization asks "how many people actually fill it once someone uses it?" These questions are related, but they are not the same. Mixing them up leads to confusion when comparing buildings or reporting results to leadership.
4 ways to improve office space utilization
Once you understand the gap between occupancy and office space utilization, a few practical changes can close it significantly.
Adjust meeting room sizes to match actual demand. Large conference rooms designed for a different era often sit mostly empty. This happens even on days when someone technically uses them.
Replacing a handful of oversized rooms with several smaller, flexible spaces tends to raise office space utilization. It does this without reducing your total meeting capacity.
Introduce booking policies that match room size to group size. Try a simple rule: require at least four people to book a room designed for ten. This one rule prevents the "one person, one large room" pattern that drags down your numbers.
Track activity alongside occupancy and usage. Whether a room sits empty or full reveals only part of the story. Understanding the specific activity taking place inside that room adds essential context.
Video calls, workshops, or quiet focus work each call for a different kind of space. Understanding this helps you design spaces that actually match how your teams work day to day.
Reassess your space mix regularly. Employee needs shift over time, especially as hybrid work patterns continue to evolve. A space mix that worked well two years ago might no longer reflect how your organization actually operates today.
How to measure office space utilization
Getting accurate office space utilization data requires more than a quick walk-through of your building. A few methods tend to work well together.
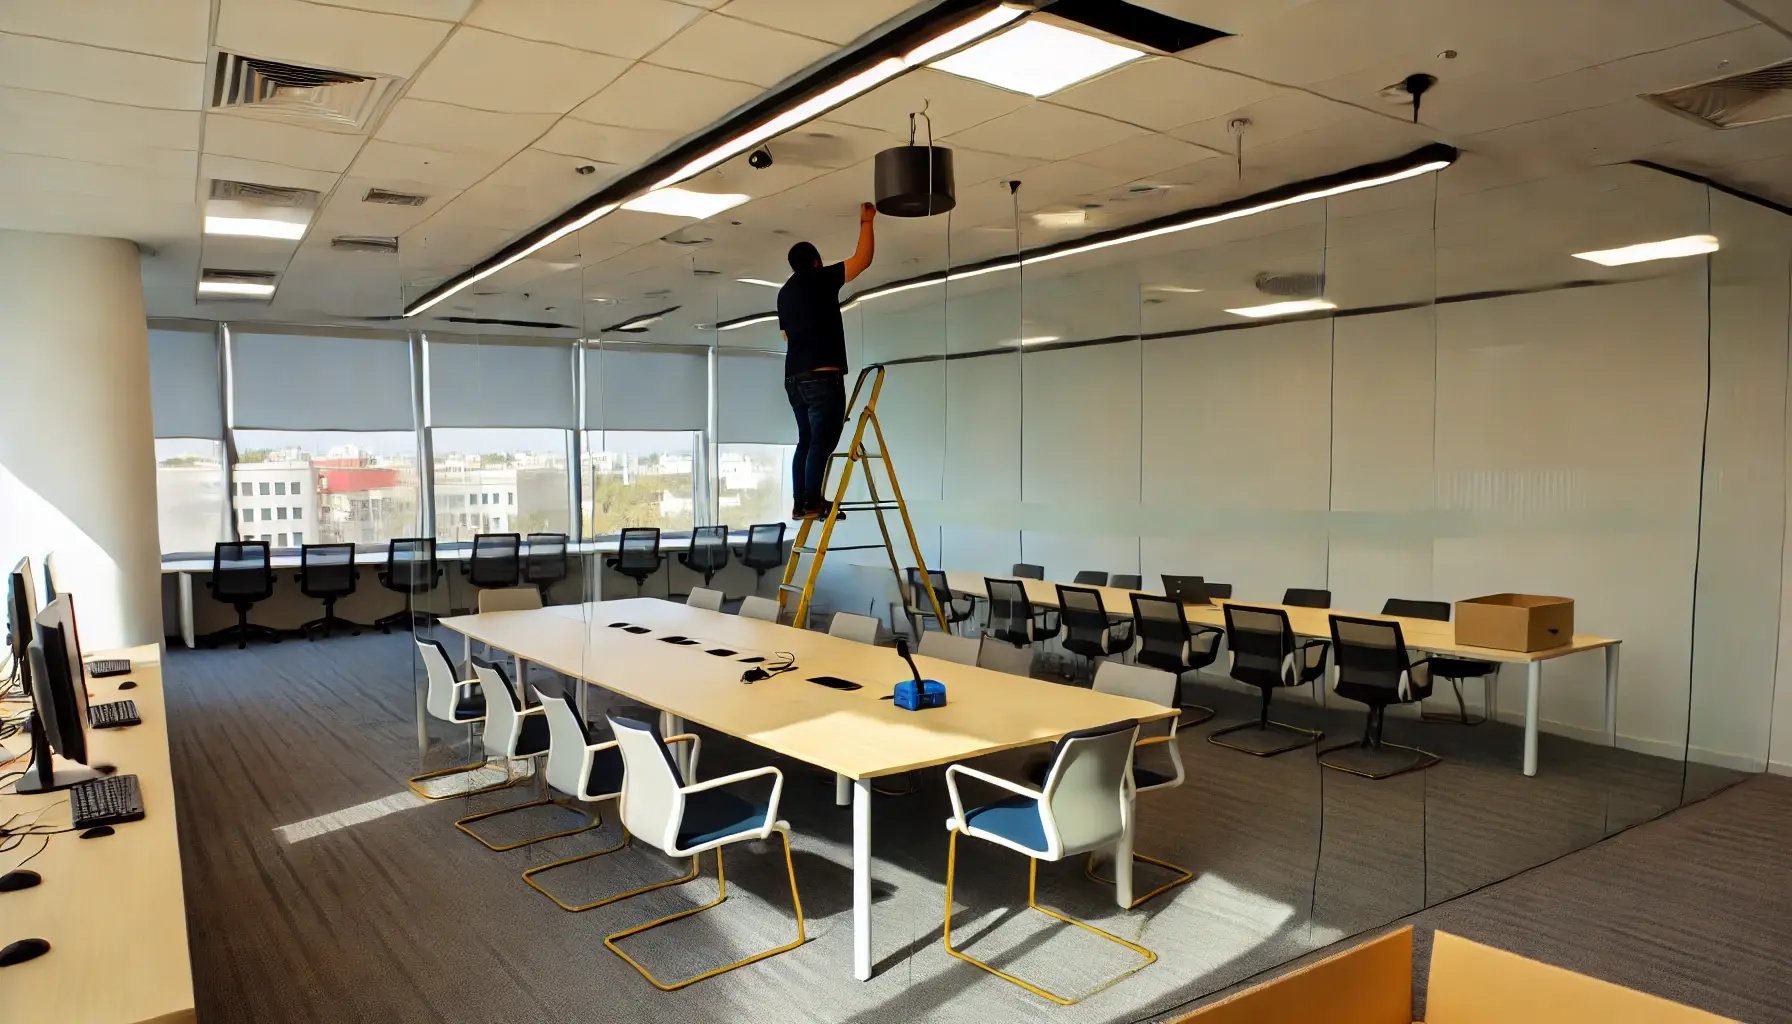
Sensor-based systems track real-time occupancy and usage automatically. This gives you continuous data without relying on manual headcounts. Occupancy sensors form the backbone of most modern data collection efforts. They capture exactly how many people occupy a space at any specific time of day.
Badge access data offers a simpler starting point. It shows broad patterns in when and how often people enter specific areas of a building.
Structured observation studies add another layer of detail. Trained researchers walk through a building at set intervals and record what they see. This method captures nuance that automated systems sometimes miss, especially around the type of activity happening in each space.
Combining these methods gives you the clearest possible picture. Sensor data shows the numbers. Observation data explains the story behind those numbers. A room with low utilization might host long video calls, or it might simply go unused at the end of a hallway.
Common space utilization measurement mistakes
Even organizations that collect data regularly can misread what it tells them. A few common mistakes recur frequently.
Relying on occupancy data alone. As the conference room example showed earlier, occupancy alone can make a poorly used space look successful. Skipping the office space utilization calculation hides the real story.
Averaging across widely different room types. A single average usage rate across every meeting room in a building can hide major differences between room sizes. Small huddle rooms might run near capacity, while large conference rooms sit mostly empty.
This blended average conceals that gap entirely. It creates the impression that both room types perform adequately, when in fact neither does.
Measuring for too short a period. A single week of data, especially around a holiday or a company event, rarely reflects normal patterns. Usage patterns often shift by season, by team schedule, and by broader workplace trends. A longer measurement window produces more reliable results.
Ignoring the human context. Numbers alone rarely explain the underlying reasons behind a space's performance. A quiet room might score poorly on usage simply because employees do not know it exists, not because nobody needs that kind of space. Pairing data with a few conversations with actual employees often reveals context that the numbers alone cannot.
Avoiding these mistakes takes a bit more effort upfront, but it pays off in decisions you can actually trust. Flawed data can lead a company toward expensive mistakes. It might cut a space type employees genuinely need, or add more of a space type nobody actually uses.
Turning utilization data into better space decisions
Tracking both occupancy and office space utilization together gives you a much clearer picture of your building's efficiency. Pairing this data with activity observations adds even more useful context. For example, you might track how often people use meeting rooms for video calls.
Understanding these two numbers side by side turns vague assumptions about your office into a concrete, data-backed strategy.
You no longer need to guess whether your building has too much space, too little space, or the wrong kind of space entirely. You can point to specific rooms, specific patterns, and specific opportunities for improvement. This clarity also makes conversations with leadership easier. Every recommendation ties back to a measurable outcome rather than a hunch.
Tracking your space utilization rate over time turns raw numbers into actionable insights. This kind of ongoing measurement supports data driven decisions rather than guesswork. It helps facilities managers plan with real evidence instead of assumptions.
Effective building use can save your organization money while improving the atmosphere and productivity of your workplace. Contact us to start measuring office space utilization, occupancy, and activity patterns in your own building.